Software Engineering Intern
Apple
Packaging Team — Shanghai, China
Overview
At Apple, I was on the Packaging Team under the Test Engineering sub-team. Packaging as in the box that you rip open every single time you buy a new Apple product.
Sounds kind of boring right? Well that's what I originally thought when coming to the Packaging Team. However, once I onboarded I realized it was much more than that. Packaging adds to the time of suspense and excitement between receiving the package and getting to hold your new product.
Not only that, packaging is key to protecting the goods inside from damage during transport, from the FATP1 to your door, while presenting the product in an intuitive Apple-like2 way. Furthermore, the packaging is where the company can cut down on costs as well as help improve the environment, by selecting certain materials, engineering the packaging design, and minimizing the amount of material used; all while still protecting the product.
Once I learned about all the constraints placed on every packaging engineer, I started to get excited about what I was going to contribute to Apple!
1 FATP: Final Assembly Test and Packout — where all Apple products are manufactured, tested, and packaged.
2 Apple-like: At Apple, all customer facing designs must go through an Industrial Design engineer who ensures that even the smallest design had that Apple magic to it.
The Problem
As mentioned above, the complex part of packaging is finding the balance between an intuitive design, minimizing cost and material use, while still protecting the product during transport from hazards.
As I was in the Test Engineering sub-team, we were focused on validating that a Product Designer's design can sufficiently protect the product against hazards. They do this by running test specifications that include drop tests, vibration tests, temperature and humidity tests, and more. The core idea here is that, if a product has no defect1 by the end of the testing cycle, it should theoretically hold up in the field.
Interestingly enough, the test specifications that are widely used across all product lines are all legacy and are largely reused with some tweaks to the specifications from product to product. The issue here is that the legacy test specifications and the tweaks made to them for each new product are based on engineering estimation.
The problem with guessing what hazards a product will experience, and how severe they are, isn't accurate. This is a big issue as there is no way to measure if the design is over-engineered because test specifications are too harsh. If the designs are under-engineered due to weak test specifications, there would be defects to the product and the product cannot be sold.
Either way, there will be money lost because the test specifications are not based on real field data. That's the problem I was brought to solve, how do we extract accurate hazard conditions from real field telemetry, and convert that into modernized test specifications?
1 Defect: Damage or disruption to the product that are not up to Apple's standard
What I Built
When starting, my team had collected a large dataset of acceleration and temperature/humidity data from real shipments, as well as the shipment logs.
However, I had to break down the problem further by answering these questions:
- How do we determine if a hazard occurred?
- What type of hazard is it?
- Where did the hazard occur?
- Why did the hazard occur?
- What is the severity of the hazard?
- How often did the hazard occur?
Task 1: Consolidating the shipment logs
- This was difficult as the shipment logs were from different companies so they had different formats. The shipments were between different countries which added complexity when finalizing timestamps. There was no mention of what mode of transportation was used for each shipment leg. The timestamps were sometimes inaccurate or incomplete. By using Python scripting, AI inferencing, and manual review, I was able to consolidate an objective shipment log which would help answer the questions.
Task 2: Identifying and classifying acceleration hazards
- I initially thought drop events were easy enough to classify as I could filter the data for high acceleration events that occurred over a short period of time. This was wrong as I neglected to realize that horizontal displacement could also have high accelerations. Through testing and plotting acceleration data points, I discovered that drop events had a specific acceleration curve that other high acceleration events did not have. As a result, I trained an LSTM model using data I collected myself to identify which high acceleration events were drop events. By doing so, I was now able to count how many drops happened in each shipment, and using kinematics I was able to determine its severity.
- Vibrations differ from drop events as they have a lower amplitude of acceleration but for a long period of time. Furthermore, there would be different vibrations that a package may experience depending on the mode of transportation. An airplane, truck, train, or boat will all have very different vibration profiles. The difficulty here was filtering noise from our data, and classifying what mode of transportation the vibration came from. By examining the PSD1 plots, I could pick out when vibration events happened, and build a vibrational profile. The next issue was determining which vibrational profile belonged to a train, truck, airplane, or boat. By using the K-Means clustering algorithm, I was able to group the profiles together, and by cross-referencing the shipment logs, I classified what caused vibration and created vibrational profiles for all 4 modes of transportation.
By the end of my internship, I had a sophisticated data pipeline that had consolidated shipment log files, drop event profiles, and vibrational profiles for all product lines based on field data. Since there are accurate test specifications, test engineers can now test designs at the level that the product is likely to see in the field. The data extracted can also be used to debug why a defect occurs, or whether it's unlikely enough to disregard. Although I didn't have hard numbers by the end of my internship, I project that my contributions potentially saved Apple $10M+ when factoring in reduced material usage and fewer engineering hours spent debugging.
1 PSD: Power Spectral Density, a graph that measures how a signal's power distributes across different frequency components.
What I Learned
From my technical work, I learned that real sensor data is extremely messy compared to test data I collect in a perfect environment. I also learned how to pick the right machine learning tool for different problem shapes. Furthermore, as I had only finished half of my second year before the internship, I got to learn a lot about signal processing fundamentals which I wouldn't formally learn in coursework until my third year.
During my internship, I got a couple of opportunities to visit the FATPs and see how they work in person. I got to see in real-time how a Product Designer, Test Engineer, and Engineering Project Manager work in parallel to debug an issue. This gave me more context on what role each engineer plays on a team, and how the company develops and manufactures products at scale globally.
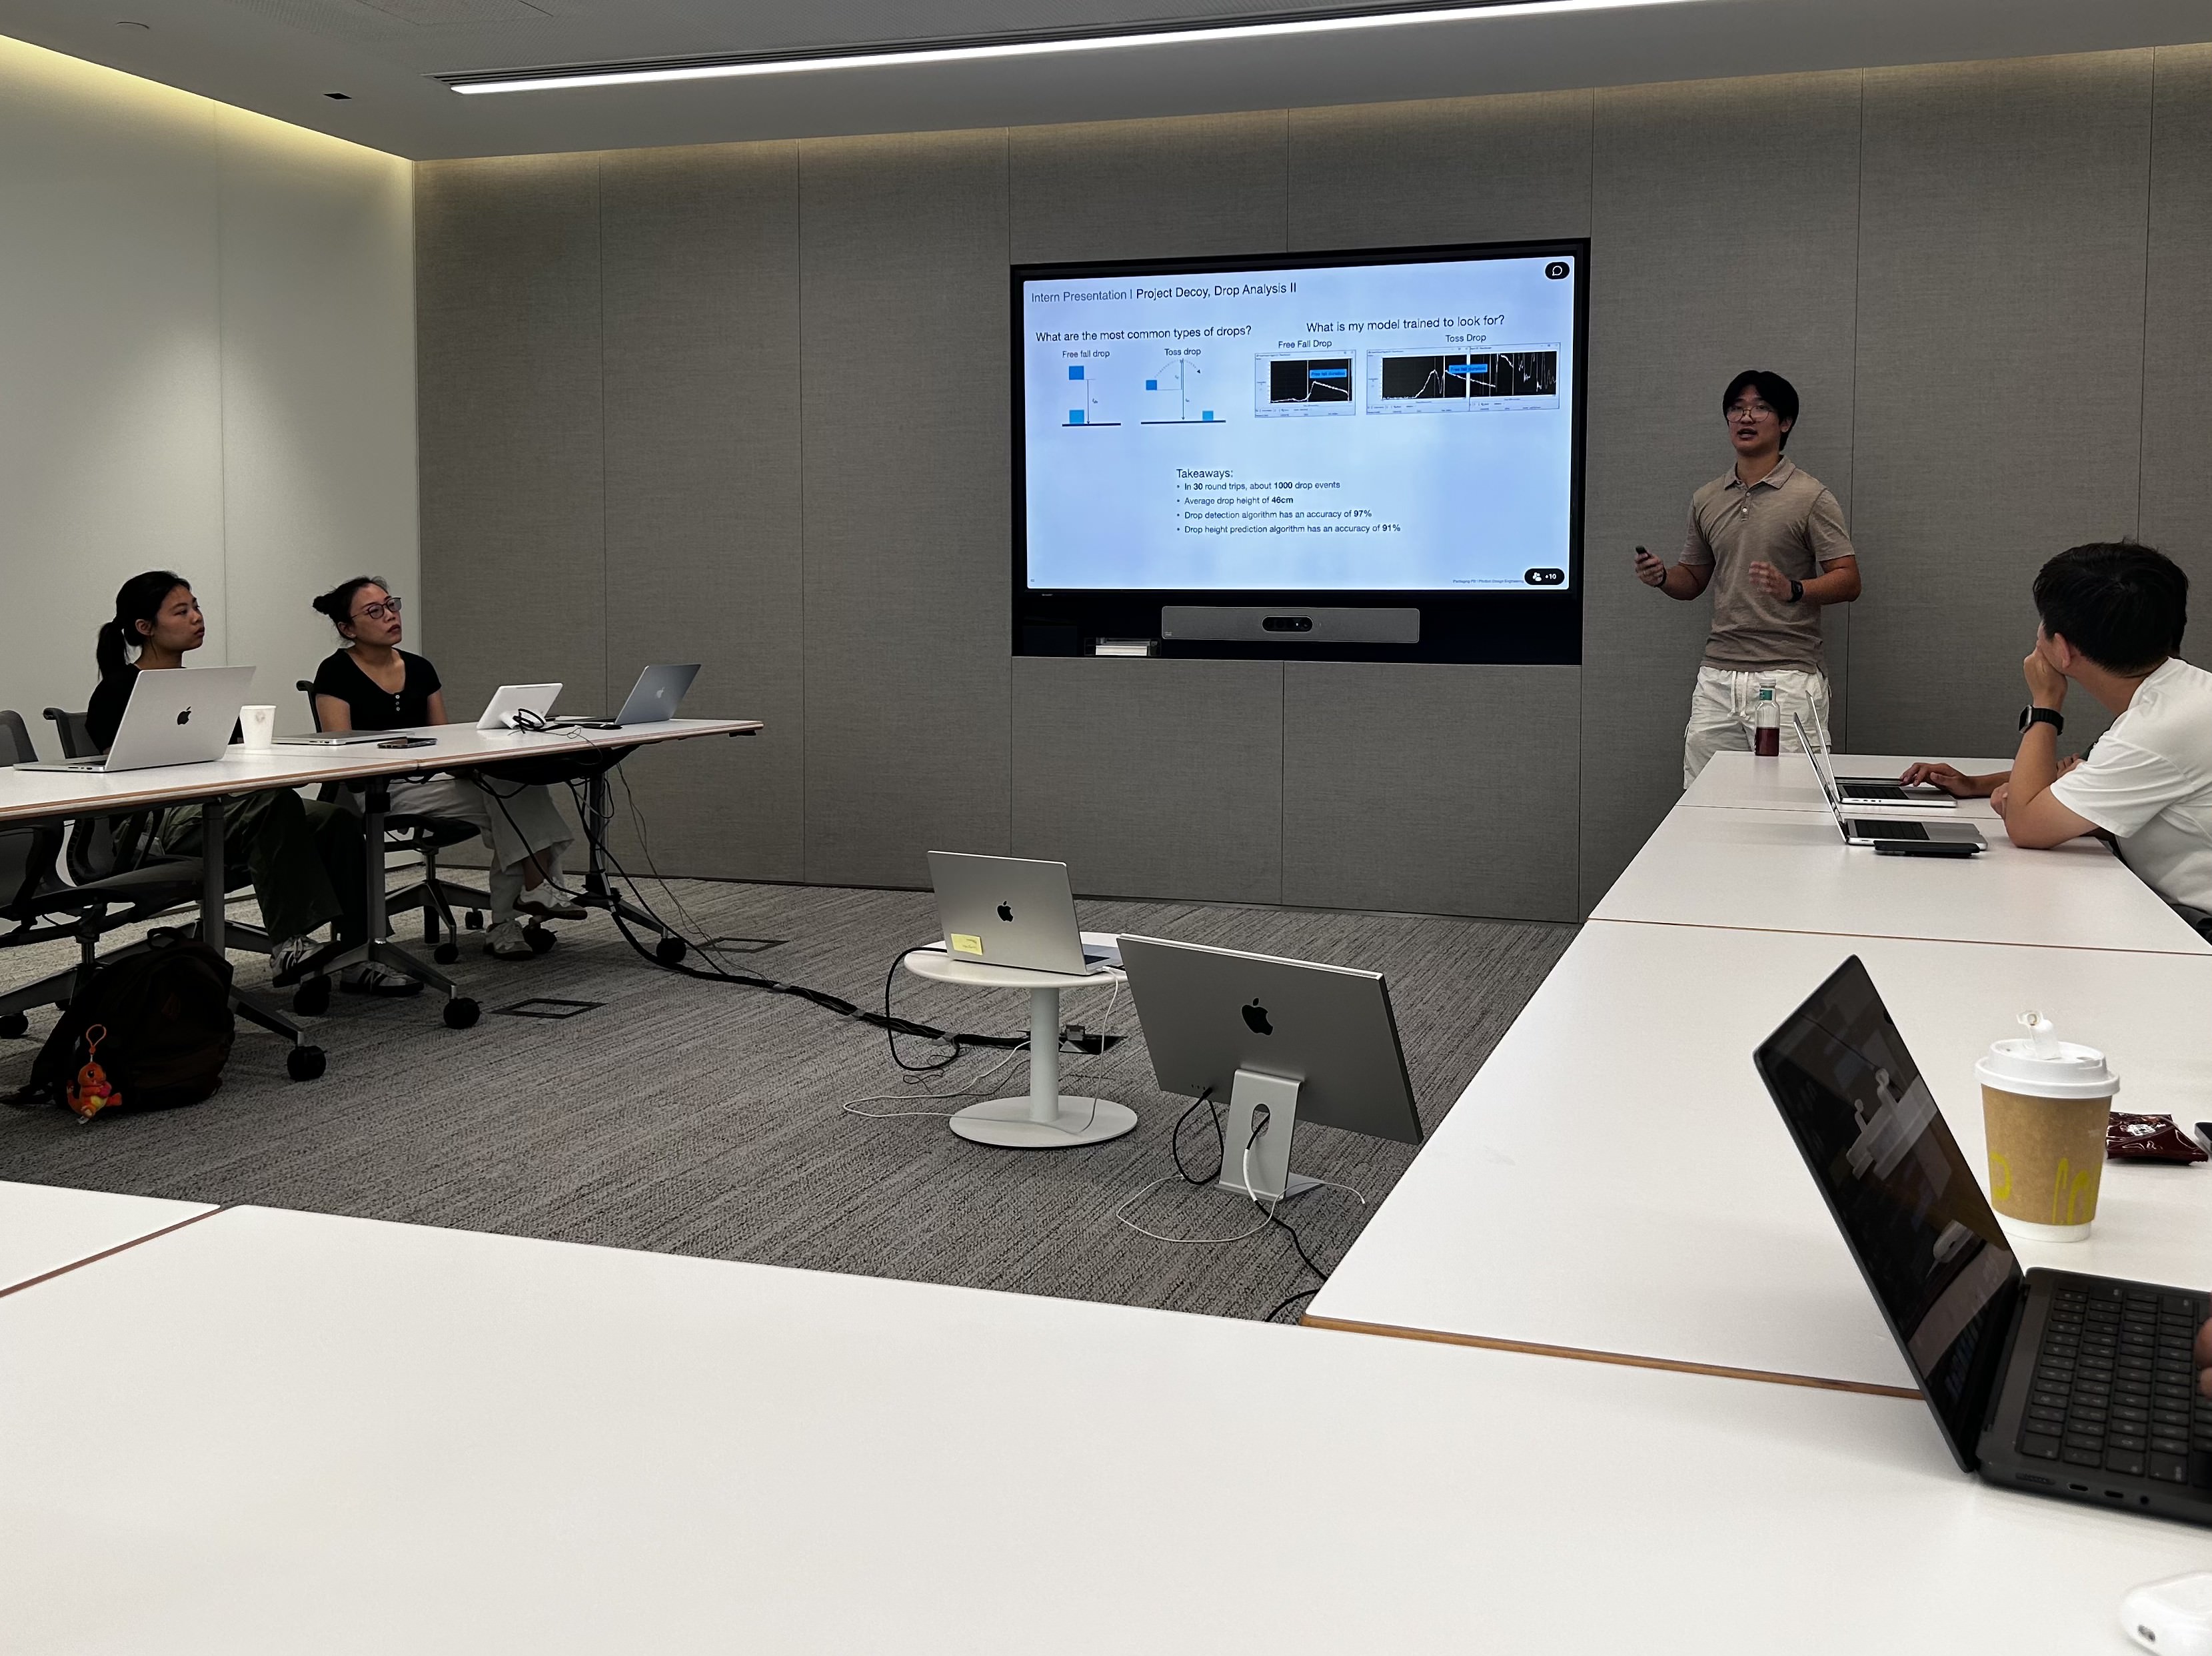
At the end of my internship, I had the privilege of presenting my work twice. Once to the entire Packaging team (~100 engineers), and again to the VP of Hardware Engineering at Apple, as well as many other senior managers in my organization. These presentations were nerve-wracking for me even though I am comfortable public speaking. I was specifically mentored by my senior manager on how to engage an audience by telling a story — showing how my contributions solved the problem.
Highlights

Experience